
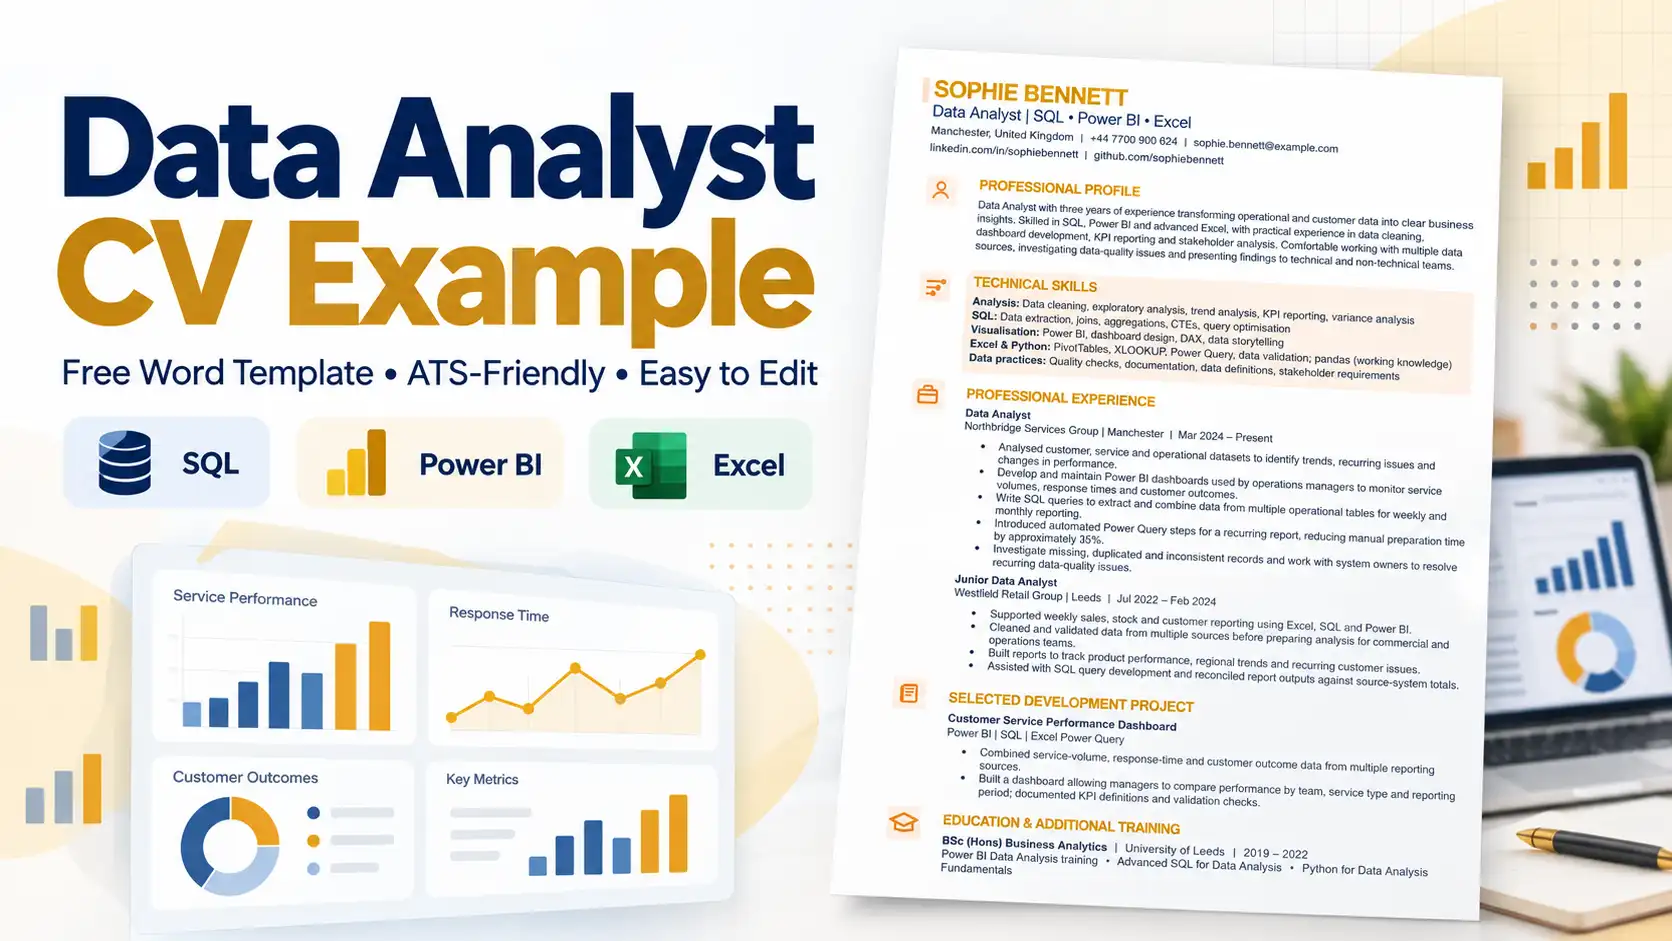

A strong Data Analyst CV should explain more than which tools you know. Employers need to understand what data you worked with, how you analysed it, which decisions your work supported and whether you can communicate findings clearly to people who are not data specialists.
This Data Analyst CV example shows how to present SQL, Excel, Power BI, data cleaning, dashboards, reporting and analytical projects without turning your CV into a long software list. You can also download the editable Microsoft Word template and adapt it to your own experience.
Data Analyst CV Example
The completed example below is written for a Data Analyst with three years of experience supporting business reporting, dashboard development and operational analysis. It demonstrates how to connect technical tools with the business problem they were used to solve.
The Word file is fully editable. Replace the sample information with your own analytical experience, tools, projects and measurable outcomes. Only include technologies and results you can confidently explain in an interview.
Completed CV Sample
The names, companies and figures in this sample are illustrative and are included to demonstrate how analytical work can be presented.
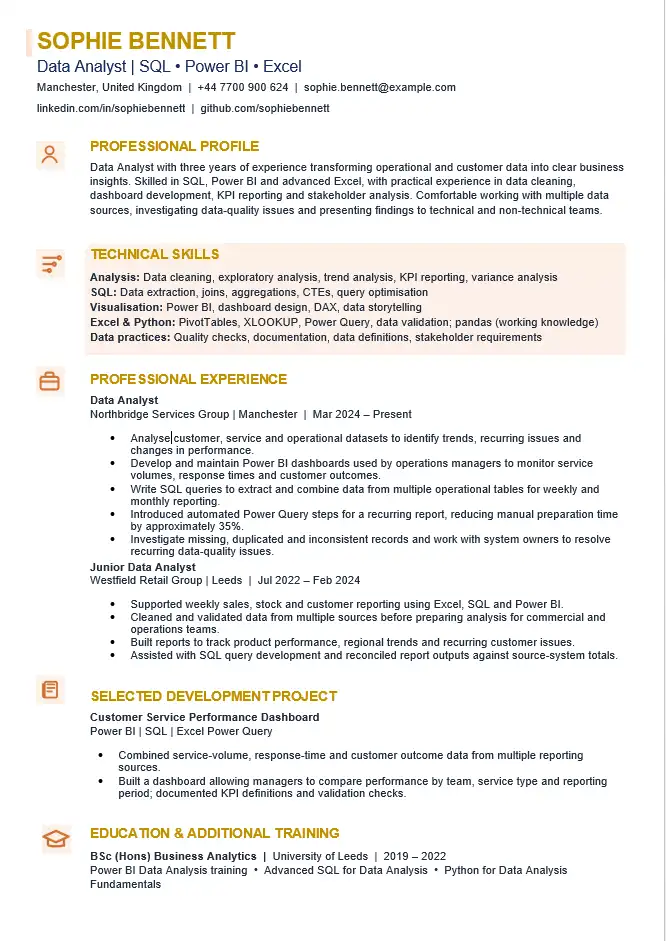
Sophie Bennett
Data Analyst
Manchester, United Kingdom
+44 7700 900 624 | sophie.bennett@example.com
linkedin.com/in/sophiebennett | github.com/sophiebennett
Professional Profile
Data Analyst with three years of experience transforming operational and customer data into clear business insights. Skilled in SQL, Power BI and advanced Excel, with practical experience in data cleaning, dashboard development, KPI reporting and stakeholder analysis. Comfortable working with multiple data sources, investigating data-quality issues and presenting findings to both technical and non-technical teams.
Technical Skills
- Analysis: Data cleaning, exploratory analysis, trend analysis, KPI reporting, variance analysis
- SQL: Data extraction, joins, aggregations, CTEs, query optimisation
- Visualisation: Power BI, dashboard design, DAX, data storytelling
- Excel: PivotTables, XLOOKUP, Power Query, data validation, reporting models
- Python: pandas, basic data transformation and exploratory analysis
- Data practices: Data quality checks, documentation, data definitions, process mapping
- Working practices: Stakeholder requirements, presentation of insights, Agile collaboration
Professional Experience
Data Analyst
Northbridge Services Group | Manchester
March 2024 – Present
- Analyse customer, service and operational datasets to identify trends, recurring issues and changes in performance.
- Develop and maintain Power BI dashboards used by operations managers to monitor service volumes, response times and customer outcomes.
- Write SQL queries to extract and combine data from multiple operational tables for weekly and monthly reporting.
- Introduced automated Power Query steps for a recurring reporting process, reducing manual preparation time by approximately 35%.
- Investigate missing, duplicated and inconsistent records and work with system owners to resolve recurring data-quality issues.
- Present findings to managers and non-technical stakeholders using concise commentary, visualisations and recommended next steps.
- Maintain metric definitions and reporting documentation to improve consistency across recurring reports.
Junior Data Analyst
Westfield Retail Group | Leeds
July 2022 – February 2024
- Supported weekly sales, stock and customer reporting using Excel, SQL and Power BI.
- Cleaned and validated data from multiple sources before preparing analysis for commercial and operations teams.
- Built Excel and Power BI reports to track product performance, regional trends and recurring customer issues.
- Assisted with SQL query development and reconciled report outputs against source-system totals.
- Responded to ad hoc analysis requests and summarised findings for colleagues without a technical analytics background.
Selected Data Project
Customer Service Performance Dashboard
Power BI | SQL | Excel Power Query
- Combined service-volume, response-time and customer outcome data from multiple reporting sources.
- Created a Power BI model and dashboard allowing managers to compare performance by team, service type and reporting period.
- Added validation checks and documented KPI definitions to reduce inconsistencies between departmental reports.
- Identified a recurring service category associated with longer resolution times, supporting a review of the underlying process.
Education
BSc (Hons) Business Analytics
University of Leeds | 2019 – 2022
Additional Training
- Microsoft Power BI Data Analysis training
- Advanced SQL for Data Analysis
- Python for Data Analysis Fundamentals
What Should a Strong Analyst CV Show?
A good application needs to connect three things: the data, the analytical work and the decision or outcome that followed.
For example, writing “Power BI, SQL, Excel” tells an employer which tools you have encountered. It does not explain whether you can turn a messy dataset into something useful.
A more informative CV shows what happened around those tools:
- where the data came from;
- how it was cleaned or combined;
- what question you were trying to answer;
- which analytical method or tool you used;
- who needed the result; and
- what decision, improvement or insight followed.
This matters because data analysis is not simply producing charts. Employers often need analysts who can understand requirements, challenge unreliable data, explain assumptions and communicate conclusions clearly.
How to Structure Your Application
Write a Focused Professional Profile
Your profile should identify your level of experience, the type of analytical work you do and the tools you use most confidently.
Experienced profile example:
Data Analyst with four years of experience analysing operational and customer data using SQL, Power BI and Excel. Experienced in data cleaning, dashboard development, KPI reporting and stakeholder analysis, with a strong record of translating complex datasets into clear business insights.
Junior profile example:
Junior Data Analyst with practical experience using Excel, SQL and Power BI through graduate projects and early-career reporting work. Confident cleaning data, building dashboards and presenting findings clearly, with a strong interest in developing further experience in business and operational analytics.
Avoid filling the profile with generic phrases such as “data-driven”, “results-oriented” and “excellent communicator” unless the rest of the CV demonstrates those qualities.
Group Technical Skills by Purpose
A skills section becomes difficult to read when programming languages, reporting tools, databases and general qualities are mixed into one long line. Grouping skills gives the reader useful context.
| Skill area | Examples |
|---|---|
| Data querying | SQL, joins, aggregations, CTEs, window functions |
| Data cleaning | Missing values, duplicates, validation, transformation, reconciliation |
| Analysis | Trend analysis, variance analysis, segmentation, exploratory analysis |
| Visualisation | Power BI, Tableau, dashboards, KPI reporting, data storytelling |
| Spreadsheets | Excel, PivotTables, Power Query, XLOOKUP, reporting models |
| Programming | Python, pandas, basic statistical analysis |
| Data platforms | Snowflake, Databricks, cloud data platforms where genuinely used |
| Business skills | Requirements gathering, stakeholder communication, documentation |
This is not a checklist of technologies every analyst should know. A role focused on operational reporting may rely heavily on Excel, SQL and Power BI, while another may involve Python, Databricks or large behavioural datasets.
Explain Data Cleaning and Preparation
Real datasets are rarely ready for analysis immediately. Missing values, duplicate records, inconsistent categories and mismatched identifiers can affect the result.
Where relevant, explain the preparation work you performed rather than jumping directly to the final dashboard.
Cleaned and joined customer and transaction datasets from three source systems, resolving duplicate identifiers and inconsistent category values before monthly analysis.
This demonstrates analytical judgement that is invisible in a simple skills list.
Show What Your SQL Was Used For
SQL is common in analyst job descriptions, but writing only “SQL” provides little evidence of your level.
| Too general | More useful CV wording |
|---|---|
| Used SQL. | Wrote SQL queries to extract, join and aggregate service data for weekly performance reporting. |
| Created reports. | Built Power BI dashboards combining SQL outputs with operational targets and KPI definitions. |
| Cleaned data. | Identified duplicate and incomplete records and implemented validation checks before analysis. |
| Presented findings. | Presented monthly service trends to operational managers using visual summaries and concise recommendations. |
Describe Dashboards as Business Tools
A dashboard is useful because somebody uses it to understand or manage something. Explain who the audience was and which problem the dashboard solved.
Developed a Power BI dashboard for regional managers to monitor weekly service demand, response times and unresolved cases, replacing several manually maintained spreadsheets.
This communicates much more than writing “created Power BI dashboards”.
Roles and Responsibilities to Include
Responsibilities vary considerably between organisations, but analyst roles often involve a combination of the following:
- collecting data from internal or external sources;
- extracting information using SQL or reporting platforms;
- cleaning, transforming and validating datasets;
- joining information from multiple systems;
- analysing trends, patterns and relationships;
- building reports and dashboards;
- investigating unusual or inconsistent results;
- documenting metrics, processes and methodologies;
- working with stakeholders to understand analytical requirements;
- presenting findings to technical and non-technical audiences; and
- supporting improvements in data quality and reporting processes.
You do not need to place all of these on your CV. Select the responsibilities that genuinely represent your experience and are relevant to the vacancy.
Show What Changed: Analytical Achievements
Analysts sometimes struggle to identify achievements because their work does not always produce direct sales or revenue. Useful outcomes can still be measurable.
- reducing manual reporting time;
- improving data accuracy;
- identifying an operational issue;
- automating a recurring process;
- reducing duplicated reporting;
- improving visibility of a KPI;
- supporting faster decision-making; or
- standardising metric definitions across teams.
Automated data preparation for a weekly operations report using Power Query, reducing approximately three hours of manual spreadsheet work each reporting cycle.
If you do not have a reliable percentage or time saving, describe the outcome without inventing a number.
Projects Worth Including
Projects are especially valuable for graduates, career changers and analysts who want to demonstrate a skill that their current job does not require.
A useful project entry should answer five questions:
- What problem were you analysing?
- What data did you use?
- How did you clean or prepare it?
- Which tools and methods did you use?
- What did you learn or produce?
Project Example
Customer Retention Analysis
SQL | Power BI | Excel
- Analysed anonymised customer and transaction data to identify patterns associated with repeat purchases and inactivity.
- Cleaned inconsistent categories and created SQL queries to combine customer and transaction tables.
- Built a Power BI dashboard comparing retention patterns by customer segment and purchase frequency.
- Documented the analysis, assumptions and limitations to make the project easy to review.
Projects do not need to claim that they changed a real company’s strategy if they were created purely for learning. Label academic and personal work honestly.
Should You Include GitHub?
GitHub can be useful when you have public SQL, Python or analytical projects that add evidence to your CV. It is not compulsory.
- explain the analytical question;
- describe the dataset;
- include a clear README;
- show important analysis steps;
- include visualisations where useful;
- explain assumptions and limitations; and
- remove credentials, private data and confidential employer information.
A repository containing only unexplained notebooks is less useful than a smaller project with clear context and documentation.
If You Have No Professional Experience
If you are applying for your first analyst position, you can still demonstrate relevant ability through projects, education, internships and analytical work completed in another role.
- SQL and Excel projects;
- Power BI or Tableau dashboards;
- university analysis projects;
- internships and placements;
- data cleaning and reporting work performed in another job;
- relevant statistics, economics or computing modules; and
- GitHub or portfolio projects where useful.
Do not describe coursework as commercial employment. Instead, explain the problem, dataset, analysis and result clearly.
Our No Experience CV Template can help you structure transferable experience, while the Graduate CV Template gives education and projects more space.
For Junior and Graduate Applicants
Graduate roles often ask for a combination of analytical potential and practical fundamentals rather than years of professional experience.
- Excel data manipulation;
- basic or intermediate SQL;
- Power BI or Tableau familiarity;
- research and analytical projects;
- attention to detail;
- clear presentation of findings;
- documentation of analytical work; and
- willingness to learn new tools and methods.
You do not need to pretend that beginner SQL is advanced SQL. A credible description of what you can currently do is more useful than an inflated skills rating.
How to Present Excel Skills
Excel remains relevant in many analytical roles, particularly where teams use spreadsheets for operational reporting, reconciliation or ad hoc analysis.
- PivotTables and PivotCharts;
- Power Query;
- XLOOKUP or INDEX/MATCH;
- conditional logic;
- data validation;
- cleaning and reconciliation;
- dashboard preparation; and
- repeatable reporting models.
The same principle applies to SQL, Python and Power BI: provide enough detail to demonstrate how the skill appears in your work.
For Senior Analysts: Move Beyond the Tool List
At senior level, technical ability remains important, but employers may also expect evidence of ownership, governance, stakeholder influence and analytical judgement.
- leading analytical workstreams;
- defining reporting standards and metric definitions;
- improving data-quality controls;
- maintaining data dictionaries or metadata documentation;
- supporting data lineage and governance processes;
- advising stakeholders on responsible data use;
- reviewing analytical outputs for quality;
- mentoring junior analysts; and
- working with compliance, technology or data-governance teams.
A senior CV should distinguish clearly between analysis you performed personally and standards or processes you influenced across a wider team.
Analyst vs Data Scientist: What Changes?
There can be considerable overlap between Data Analyst and Data Scientist roles, but they should not automatically use the same CV emphasis.
An analyst application may place greater emphasis on business reporting, SQL, dashboards, stakeholder requirements and interpretable insights. A Data Scientist position may require more evidence of statistical modelling, machine learning, experimentation or programming depth.
Some roles sit between the two. In that case, use the actual job responsibilities to decide which evidence deserves the most space rather than relying on the title alone.
Choosing the Right CV Format
A practical structure is:
- Name and contact details
- Professional profile
- Technical and analytical skills
- Professional experience
- Selected data projects
- Education
- Relevant training or certifications
Recent graduates may place education and projects higher. Experienced analysts should normally allow professional achievements to take priority.
Keep the document readable. An analyst CV does not need charts, skill bars or decorative dashboards inside the CV itself. The CV should describe your analytical work; your portfolio can show detailed visualisations separately.
If you want a straightforward structure for online applications, see our ATS-Friendly CV Template for Word. No CV template can guarantee compatibility with every applicant tracking system.
Common Mistakes
- Listing tools without evidence: show how SQL, Power BI, Excel or Python were used.
- Ignoring data preparation: cleaning and validation are meaningful parts of analytical work.
- Showing dashboards without a purpose: explain who used them and what question they answered.
- Overstating technical proficiency: distinguish basic familiarity from professional use.
- Using unsupported impact figures: quantify only results you can justify.
- Forgetting communication: analysis has limited value if nobody understands the finding.
- Including unexplained GitHub links: provide context and documentation for public projects.
- Mixing analyst and Data Scientist claims: tailor your evidence to the actual role.
- Using a generic CV for every position: reporting, product analytics, governance and behavioural analysis can require very different evidence.
Frequently Asked Questions
What should I include in a Data Analyst CV?
Include a focused profile, relevant analytical and technical skills, professional experience, selected projects and education. Show how you use tools such as SQL, Excel and Power BI rather than simply listing them.
What skills should a Data Analyst put on a CV?
Useful skills can include SQL, Excel, data cleaning, Power BI or Tableau, dashboard development, data visualisation, analytical thinking, stakeholder communication and documentation. Python, cloud platforms and other tools should be added when relevant to your actual experience.
Can I become a Data Analyst with no experience?
Entry-level opportunities exist, but you still need evidence of analytical ability. Projects, internships, university work and analytical responsibilities from other jobs can demonstrate SQL, Excel, visualisation and problem-solving skills.
Should I include projects?
Projects are particularly valuable for graduates, junior analysts and career changers. They can also help experienced analysts demonstrate technologies or analytical methods not used in their current position.
Should I put GitHub on my CV?
Include GitHub when it contains relevant, well-documented public analytical work. It is optional, and professional experience on private systems does not need to be reproduced publicly.
Is Excel enough for an analyst role?
Excel can be highly relevant, but many positions also require SQL, visualisation tools or other analytical technologies. Match the skills section to the specific role and describe how you have used each important tool.
Download the Free Word Template
Download the editable Word example and replace the sample information with your own analytical experience, SQL skills, dashboards, projects and education.
For related examples and templates, explore our CV Examples, Graduate CV Template and No Experience CV Template.